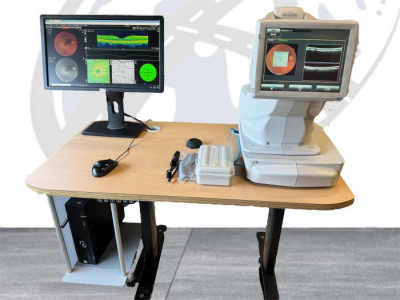
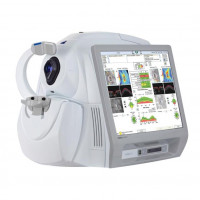
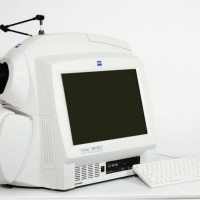
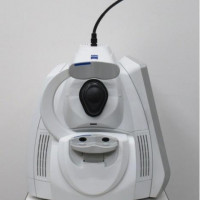
Key features
Angiography
OCT and true color* fundus photography
Fully automated image capture
3D wide scan with Hood Report for Glaucoma
Panoramic fundus imaging
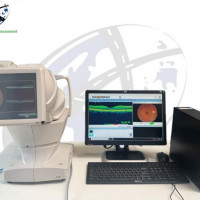
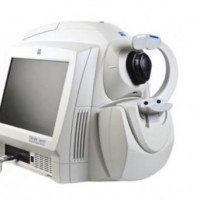
User-friendly A user-friendly OCT. The Maestro2 uses robotic technology and improves practice efficiency whilst providing optimal patientcare. Fully Automated Capture With a single touch, the Maestro2 automatically performs alignment, focus, optimization and capture. After image capture, the report can be immediately displayed by clicking on the icon. Manual/Semi-Automatic Capture In addition to automated capture, the Maestro2 offers manual/semi-auto options for difficult-to-image patients.
Auto Align. Auto Focus. Auto Capture.
Widefield OCT Scan The Maestro2 can capture a 12mmx9mm widefield OCT scan, encompassing both the macula and optic disc. Ideal for an annual eye exam, the scan reduces patient testing time. It provides thickness and reference data for the retina, RNFL and ganglion cell layers together with a Glaucoma report which includes disc topography. GCL : The thickness of GCL and IPL GCL : The thickness of GCL, IPL and RNFL
Hood Report for Glaucoma with Probability Maps with 3D Wide 12x9mm Scan Retinal Thickness/RNFL/GCL and probability maps, all in one report. The New Hood Glaucoma Report is now available. This innovative report streamlines the decision-making process through the correlation of structure (GCL/RNFL) with function (overlay of visual field test locations). Donald C. Hood PhD, Translational Vision Science & Technology No.6 Vol.3 2014: Evaluation of a One-Page Report to Aid in Detecting Glaucomatous Damage.
Maestro2 – Now Featuring OCT Angiography Introducing fully automated OCT Angiography1 At the touch of a button, Maestro2 provides instantaneous vascular flow information without the need for contrast dye injection, together with comprehensive segmentation to enable advanced diagnosis. OCT Angiography includes OCTA Density.2 1 OCTA optional extra in some countries. Please check with the distributor in your country. 2 The OCTA Density is defined as the ratio between the high signal area and low signal area and it is displayed in color and/or number.

